




How To Use Excel As A Database: A Practical Guide
27 January 2026 · Loïc Ribet · 15 min
While the first article of my series on data management examined frequent mistakes in using Excel for data storage. This one is dedicated to helping you avoid them from the start.
It may seem paradoxical, but please remember that I am still not advocating for Excel as a permanent solution for storing and managing compliance and legal data. There are much better tools for that and I look forward to discussing them in future articles. But if Excel is currently your only option (and for many teams, it still is the case for various reasons), the guidance below will help you make the most out of it.
I have prepared a clean Excel file that contains all the examples and implementations discussed that you will be able to download at the end of the article. In the next article, I will also provide you with ready-to-use templates for various Compliance and Legal topics. I strongly recommend reading the tips below before downloading anything, so these practices become second nature.
As a continuity of the first article, I continue using an Employee Register as example, but the principles apply to any compliance or legal dataset.
Use Excel “Tables”, no more Ranges of cells
There is a concept in Excel that is too often ignored: the Excel Table. This is by far, one of the best concepts to implement. And I am not talking about a bordered range of cells. An actual Excel Table is a specific feature that tells Excel: "This data is structured".
Turning your list into an Excel Table immediately improves:
- Filtering
- Sorting
- Consistency
- Automation (many tools integrate better with Tables)
- Data quality
- Formula stability
- Readability
How to check if your list is an Excel Table?
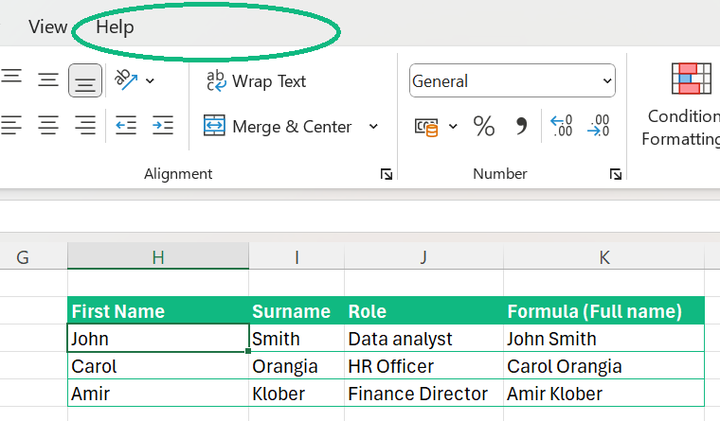
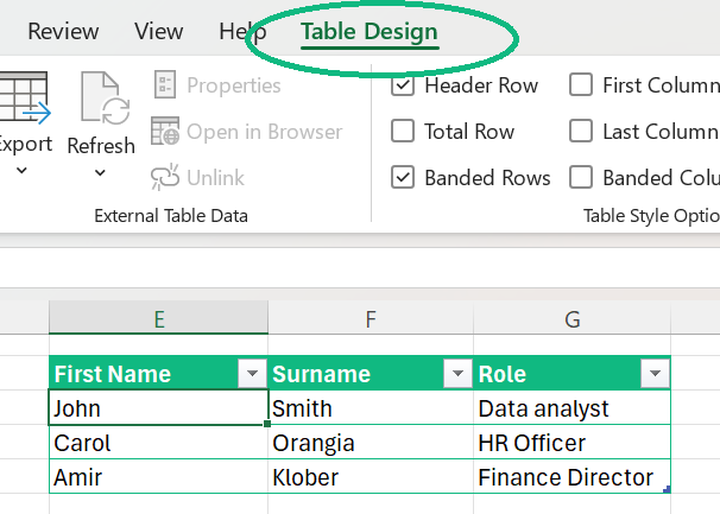
Click any cell in the range of data and look at the top ribbon. If the “Table Design” tab appears: it’s an Excel Table.
Screenshot 1: This is not an Excel Table
Screenshot 2: This is an Excel Table
Advantages of using Tables
1) You can’t merge cells in a Table
This is a good thing! In a table, Excel won't let you merge rows or columns. I know this may disturb some of you. But based on my experience, there is no good reason for you to merge rows or columns in a table of data.
If you feel the need to merge cells, resist the temptation and simply repeat the value instead.
2) Automatically expand data validation
If you add data validation to a column, Excel Tables automatically apply it to any new row. See below for a section on data validation.
3) Automatically expand conditional formatting
Same principle: formatting rules grow with the Excel Table. This is especially appreciable when adding new rows.
4) Formulas become human-readable
Tables use structured references which are much easier to read and debug.
Instead of:
=CONCAT(C6," ", D6)
You read:
=CONCAT([@[First Name]], " ", [@Surname])
5) Simplified design
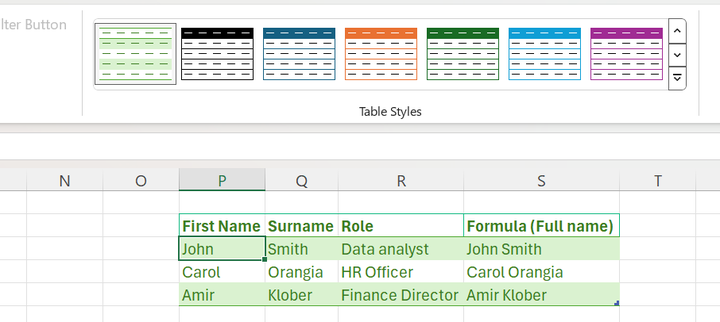
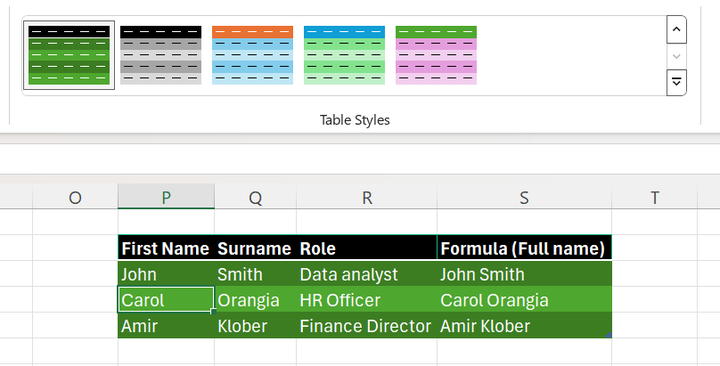
Excel Tables come with built-in styles. You can quickly set up and apply designs to make your data easier to read.
Design: Example #1
Design: Example #2
Excel Tables enforce structure and clarity. They remove bad habits and apply professional design automatically. I suggest you to ensure that all your data are within Excel tables.
One Table, One Sheet, One Entity
What is an Entity?
In the database world, the term “Entity” is simply the thing your table describes. This thing has attributes, which are its descriptive properties. In relation to an Employee Register:
- the entity is "employee".
- the attributes include: first name, last name, hire date, etc.
In the world of Legal and Compliance, other examples of entities are: Breaches, Legal Clauses, Contracts, Clients, Policies, Audit Actions, Reviews, Tasks, Regulations, Regulators...
One rule to implement: One table per entity
Once you understand what I mean by "Entity", there is a simple rule to apply. And from experience, the non-application of this rule is one of the most common design errors in Excel I have seen.
The rule: One entity = One table
If your table stores a single “thing”, you must create a single table. With regards to an Employee Register, you should not split data across sheets such as:
- Active vs. Inactive
- One sheet per year
- One sheet per department
- One sheet per office location
A single additional column (“Status”, “Hire year”, “Department”) solves the problem.
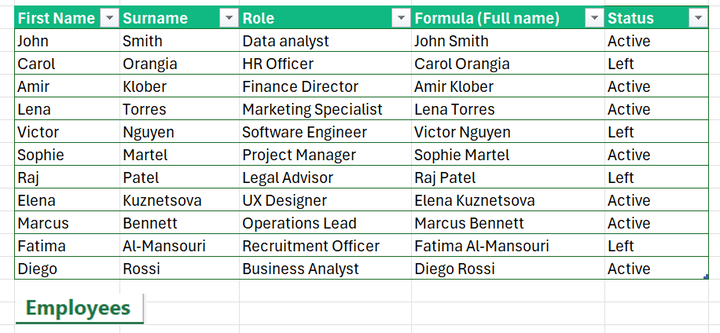
Correct structure:
In the below example, all employees are in a unique table. There is a column "Status" to allow filtering based on status.
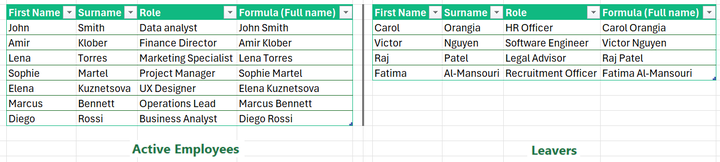
What you should avoid
In the below example, the employees are split into two tables based on whether there are still working in the company. This is the type of split that should be avoided. Not only it is inefficient, it actually increases risks (operational, regulatory, legal etc.).
Good reason to split: The only good reason to split is when your table actually relates to different entities:
- Employees vs. Breaches (different entities)
- Contracts vs. Clients
If the data represents the same “thing”, keep one table (i.e., in practice this means one tab) and add columns to reach the intended goal (Status, Hire Year, Category, Department). Only split into different tables when the entities are truly different. You may feel that it is not always clear-cut, and you are right, so approach this on a best-effort basis.
Create a Primary Key column (Index / Ref.)
When creating a table, this should be the first column you create. Every single one of your tables should contain a column that uniquely identify each item. In technical term, we talk about "Primary Key".
This “Primary Key” should be:
- Unique
- Not empty
- Never changing over time
How to choose a primary key?
The best option is to use an incrementing ID column where each item is assigned to a number from 0 or 1 to infinity automatically (0, 1, 2, 3 etc..). You can also use existing columns but this is where most mistakes come from if you choose a column that does not meet the above criteria (uniqueness, not empty, immutable). For instance, choosing the email or full name in an employee register is not a good idea because the value can change over time or be empty even if that's rare.
If you want an identifier with some sort of meaning instead of a simple number, a good approach is to add a prefix. In such cases, I recommend using leading zeros, as they make sorting easier and more reliable when needed (technically, the data type would become a string, i.e., a text, and not a number [this change has various consequences not discussed at this stage]). The number of leading zeros depends on your estimate of how many items the database may eventually contain.
Good examples:
- 1, 2, 3, 4
- EMP0001, EMP0002 (contains leading zeros)
- BREACH00001 (the estimate is less than 99999 breaches)
- POLICY0023 (the estimate is less than 9999 policies)
Why the Primary Key matters:
- Prevents duplicates
- Makes automation and analysis easier
- Allows linking with other tables
- Serves as a stable reference
Additional tip for Excel
In most databases, the Primary Key would be the first column. However, I don't advise this for Excel because most of the time you can "automate" this primary key with a formula. And adding a row is usually done on the first column which would delete the formula. To really understand this, please download the file at the end of the article and look at the tab "Primary Key".
Never build a table without a Primary Key. It is the backbone of your dataset. Even if you don't use it directly, it will be useful as some point, for your data team or later on if you decide to create relationship with other databases.
Using Data Validation
Data validation helps you control what users are allowed to type into a cell, it acts like a gatekeeper. This dramatically improves data quality before errors even occur, and drastically decrease the time needed to clean the data.
- If the value matches a specific rule, then Excel accepts it
- If not, Excel blocks it and warns the user
It prevents issues like:
- writing "Risk Dep." instead of "Risk Department"
- entering “Next Thursday” or "unknown" instead of a date (DD/MM/YYY)
- typos creating new categories
- numeric fields receiving textual values
Data validation work by implementing rules like:
- Dates only
- Choose from a dropdown
- Numbers within a range
- Custom rules for more complex control of the data
Limitations
Data validation is useful, but remember that Excel is not a real database. As a consequence, there are some known weaknesses:
- Easy to bypass: Copy/paste can ignore rules entirely.
- Rules can be removed: Users can accidentally delete validation.
- Limited rule types: Only simple constraints are supported.
- Doesn’t apply retroactively: Existing data remains unvalidated.
- No mandatory fields: You cannot truly enforce required values.
- No user-level controls: Anyone with editing rights can change rules.
How to implement data validation
In additional to the below simple tutorial, I strongly advice to download the Excel file at th end of the article that will show you concretely how I've implemented different types of data validation.
Keeping it simple:
- Step 1: Select an entire column
- Step 2: Data → Data Validation
- Step 3: Choose the rule (date, list, number, etc.)
Data validation can drastically improve the quality of your data. Even if it does not replace a real database, they can be highly beneficials.
Tips
- I usually keep the dropdown values in a separate “Config” sheet and hide it once the setup is done.
- You can also enable an input message and an alert message to guide users and make the rules clearer.
Prefer dedicated columns over generic ‘Comments’ columns
Comments columns can be useful but are often overused. Before creating a Comments column, ask yourself:
- What information do you think users will input in this column
- For each type of information, should not it deserve its own column?
- Will this value be used for analysis or filtering?
Comments are fine for unexpected notes, but not for expected attributes.
An example of what not to do
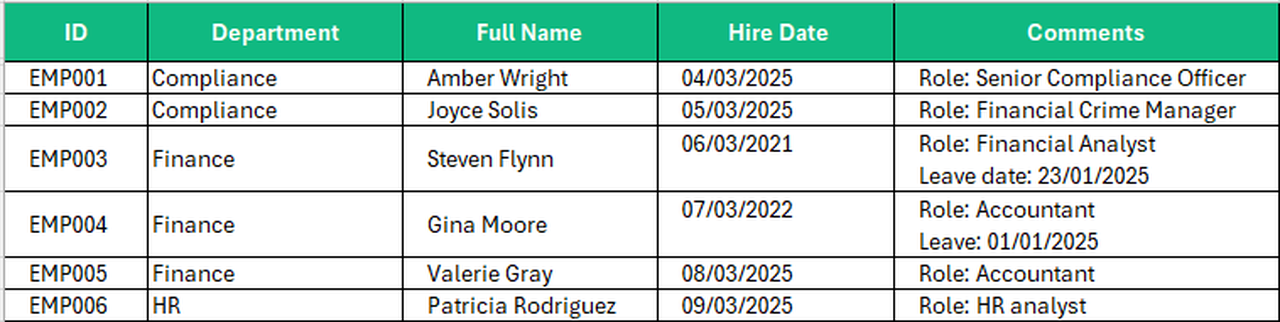
In this example, the Comments column contains important information in most of the rows. The best approach is to use dedicated columns instead to store the data.
Correction

In this example, dedicated columns have been created. You can still have a Comments column that will only store unexpected information.
Use comment fields only for exceptional cases. If information is important or recurring, create a dedicated column. Repeated or dense comments usually indicate missing columns and poor table design.
Enhance Visual Structure (Why UX/UI Matters in Excel)
In cases where your Excel is used by more than one person, I strongly advice you to invest a bit of your time on the User Experience Design (i.e., UX) and User Interface Design (i.e., UI). Do not see it as only a cosmetic benefit but also as risk mitigation. To make things simple, I follow one principle:
- Principle of Least Astonishment: the file should make sense without explanations. Put yourself in the shoes of someone that sees your Excel file for the first time and needs to use it.
Benefits:
It improves adoption and collaboration
Let’s face it: if a spreadsheet looks chaotic, people avoid using it. If it looks clean and intuitive, they follow it. The nicer the experience, the more consistently people will enter data, which directly improves data quality.
It speeds up data entry and review
When fields are easy to locate, columns are named consistently, and the flow makes sense, users work faster and make fewer mistakes. A clear layout lets them stay focused on the content, not the structure.
It makes the file future-proof
A well-designed file is easier to modify, extend, or integrate with automation tools. Bad files have to be rebuilt from scratch.
What to do to improve the UX/UI of your Excel Tables?
I’m not a UX/UI expert, but I’ve learned that a few simple habits can make an Excel file much easier to use. I often borrow ideas from websites I find intuitive: clear titles, clear instructions, and a layout that doesn’t require guesswork.
Here’s what I usually do:
- Add a clear title and a short description so users immediately understand what the table is about.
- Use dropdown lists wherever possible to avoid typos, inconsistencies, and creative spelling variations.
- Use conditional formatting to highlight important information (e.g., overdue actions, inactive records). It tends to be hard to maintain so use it sparingly.
- Write helpful error messages for data validation rules. If a value isn’t allowed, the message should tell the user what you expect, not just “This value is invalid.”
- Freeze the header row so users never lose track of what each column represents.
- Keep columns in a logical order of entry (e.g., Name, Status,, Dates, Notes). A clean flow makes data entry faster. Think about what the user would enter first, then second etc. For instance, in an Employee Register, it is unlikely that the user will start with the job title. Exception for the Primary Key as explained above.
- Use formatting consistently (same font size, aligned text, standard column widths). Consistency builds trust in the file.
- Apply the colours from your company’s graphical chart to make the file feel familiar, consistent, and professionally integrated into your organisation’s identity.
- Group “configuration” elements separately (for example, put all your dropdown lists or rules in a hidden “Config” sheet). This keeps the main sheet clean.
Good UX/UI is not only about making the file look pretty. It is about making it obvious, predictable, and difficult to misuse. It also reduces user mistakes and improve data quality. Spend an extra hour on your file can make a huge difference long-term.
Add Guidance / documentation to the File
Most spreadsheets maintained in Legal and Compliance departments have zero documentation which is quite paradoxical from my point of view. Yet a small amount of guidance / documentation have several benefits: audit, maintenance, adoption etc.
Here as well I am applying a simple principle: Design for your future self (or anyone else)
I try to imagine that someone else, or future me in two years, with no memory of the details, will have to modify the file. If that person wouldn’t understand the structure without spending an entire day digging through all the details, then I know I should add more clarity or context.
There are two ways to document your file:
1. Add guidance on the same sheet
A short note, small explanations, or onboarding text above the table can be very effective.
2. Use a dedicated documentation sheet
Useful for:
- Data dictionaries
- Definitions
- Business context (audit recommendation, regulations, laws, organisation etc.)
- Instructions for multiple teams
- Audit readiness
- Version control / history
Documentation helps users understand the reasons why the table was created. It reduces errors and confusion. Add guidance where it is most visible and use a dedicated sheet for more complex files.
Conclusion
My goal here was not to turn you into an Excel expert, but to give you a few practical habits that will make your files more reliable and a lot less painful to work with. You and your colleagues will benefit it.
- Use Excel Tables, not unstructured ranges
- One entity = one sheet
- Always create a unique identifier column
- Enforce data types with data validation
- Invest a bit of time in the UX/UI of your file
- Add guidance so users (and your future self) understand the file
If you want to see how all of this looks in practice, I really encourage you to open the Excel file I prepared for you (see below). It includes every example mentioned in the article, plus concrete implementations of the tips we discussed. Sometimes seeing it in a real file is much easier than imagining it. It is obviously free without any counterparty.

If you enjoyed reading this article, I have good news for you: the next article will go one step further. I will share ready-to-use templates for different Compliance and Legal topics. All built using the principles we have covered here. You’ll be able to download them, adapt them, add in your data, and get started straight away.